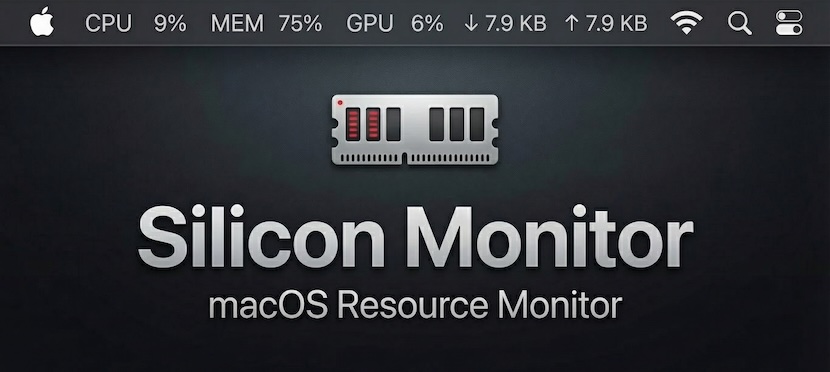
A native macOS menu bar system monitor for Apple Silicon.
Features • Why • Comparison • Installation
Features
- Zero Impact — Written in Rust. Minimal CPU (< 0.1%) & Memory (~15MB) usage.
- Native Design — Template icons adapt automatically to your wallpaper/theme.
- Apple Silicon Ready — First-class support for M-series GPU monitoring.
- Fully Configurable — Toggle CPU, GPU, Memory, or Network stats instantly.
- Battery Efficient — Smart polling that won’t drain your MacBook.
- Privacy Focused — 100% local. No analytics. No network requests.
Why?
I built this out of necessity. After switching from Ubuntu to macOS, I missed the simplicity of the GNOME Resource Monitor extension—just a clean line of text showing me exactly what my system was doing.
I tried everything else:
- Electron apps were too heavy (~150MB+ RAM for a text label? That’s the “Electron Tax”).
- Paid apps were overkill and expensive ($15+ with paid upgrades).
- Free alternatives often lacked proper Apple Silicon GPU support or didn’t match the OS aesthetics.
Silicon Monitor is the answer. It uses native macOS APIs (specifically the private IOReport framework) to monitor your Apple Silicon GPU usage and power draw with zero overhead.
How it works
- Hybrid Architecture: Uses
sysinfocrate for standard metrics (CPU, Memory, Network). - Advanced GPU Monitoring: Uses
IOReportFFI to access private macOS APIs for accurate GPU residency (not just utilization). - True Insight: Calculates
GPU Active ResidencyviaIOReportCreateSubscriptionand sample deltas, providing precise workload data.
It calculates active residency instead of just “utilization,” giving you true insight into your GPU’s workload. It runs without sudo, and looks exactly like a native system component in both light and dark modes.
Comparison
| Feature | Silicon Monitor | Stats | iStat Menus | Electron Apps |
|---|---|---|---|---|
| Price | ✅ Free | ✅ Free | ❌ $14.99 | ❌ Varies |
| Open Source | ✅ MIT | ✅ MIT | ❌ Proprietary | ⚠️ Varies |
| Idle Memory | ✅ ~15 MB | ⚠️ ~45 MB | ⚠️ ~60 MB | ❌ 150-400 MB |
| CPU (Idle) | ✅ < 0.1% | ✅ < 0.5% | ✅ < 0.5% | ❌ 1.0 - 3.0% |
| App Size | ✅ < 7 MB | ⚠️ ~30 MB | ⚠️ ~40 MB | ❌ > 100 MB |
| GPU Metrics | ✅ Native (Residency) | ✅ IOReport | ✅ Proprietary | ❌ Utilization % |
Installation
Download the latest binary from Releases.
Build from Source:
git clone https://github.com/alexx855/silicon-monitor.git
cd silicon-monitor
pnpm install
pnpm tauri build
Made with ❤️ by Alex Pedersen